The great new features of Wireshark 1.99

The great new features of Wireshark 1.99
I have been looking at Wireshark 1.99 since Octobre 2014. But with the Development Release 1.99.6 it is the first time that I have the feeling that I can use it productive in a short period of time.
Don´t understand me wrong, I like nearly every new feature which has been implemented in Wiresahrk 1.99 by now. But I missed the old ones, because I need them.
But now I can say, that my personal usage change to the new Wireshark 2 is near for me. So I just want to use this fact to write a little note about the cool new features I realized so far.
The Wireshark developers have have done a very impressive job so far from my point of view. In Octobre 2014 it was not clear for me why they want to develop a new Version and what should be better with the new one, because the old Version is one of the most popular programs of our days and I like to use it. And packet decode is packet decode.
So it came that the first Version didn´t impressed me really. It was even worther I thought I used an ethereal compared to the featured which where implemented at that time at Wireshark 1.12 . But as I told the actual version is really impressive to me and so I will talk a little bit about the new cool stuff.
First great newly feature: I will call it the “grey ribbon”
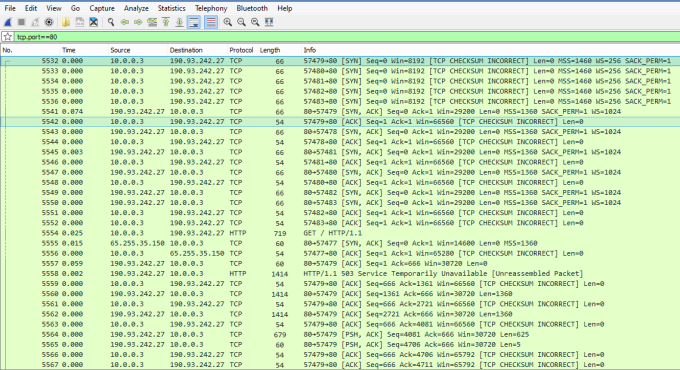
It is the feature what makes me most speechless as I realized the first time. In a trace you can see on the left side a small grey line related to the packet. The line tells you which packets are related to this session. This makes a lot of sense, because modern “intelligent” web applications opens a lot of sessions at the same time to transmit their content. I think I mus not describe how awfull it is to find the related packets in a trace if you don´t can filter to stream at that moment. But with this new “grey band” you can see which packets belong to the flow.
In a case of a UDP-flow you can see which packets belong to each other.
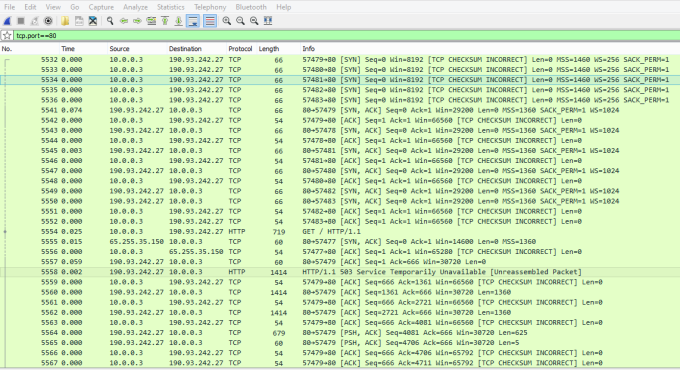
In a case of a TCP-flow you can see which packets belong to the flow and which are not. If a packet belongs to the flow of the selected packet the ribbon is continues in front of these frames. If a packet does not belong to the active flow than ribbon is dashed.
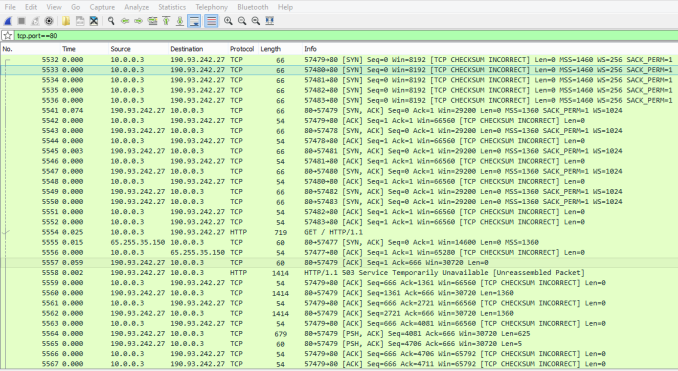
Furthermore the ribbon presents which packet has been acked by a selected ACK. In front of the acked packet a check mark will be displayed. In the picture below FRAME 5557 contains the ACK for the Segment of FRAME 5554.
In case of Duplicated ACKs the original ACK of the selected Duplicated ACK will be highlighted by a double check mark. In the picture below you can see that FRAME 17 contains the Duplicate ACK for the Segement of FRAME 5554.
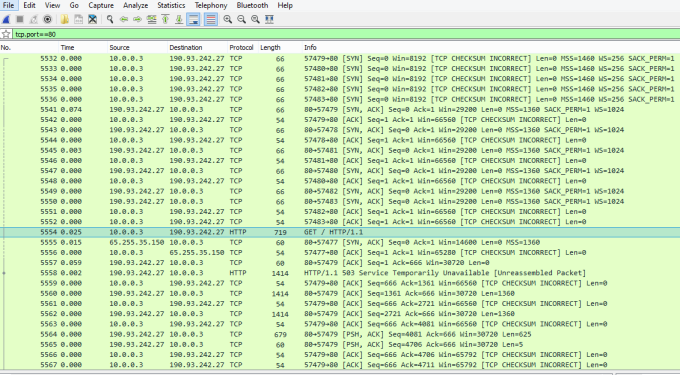
In the case of an aplication Request / Response you can see which request belongs to which response and the other way round.
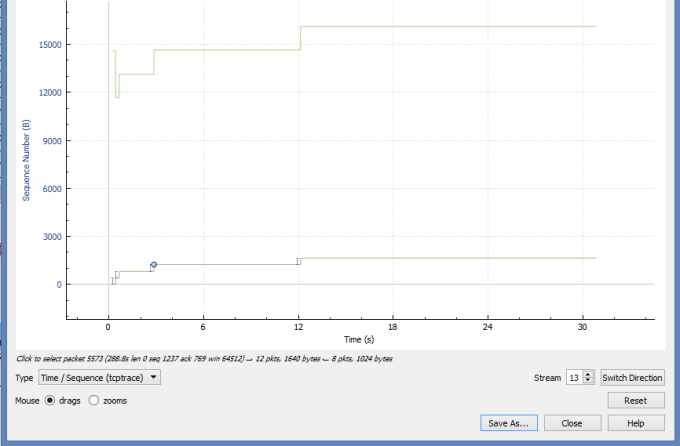
Second great improved feature: TCP Streamgraph
If you are working a lot with tcp streams and investigating performance issues you probably have seen the TCP Stream Graphs in Wireshark. I personal haven´t worked a lot with this Graphs in Wireshark so far because they had, friendly said, a not so nice ergonomical user experience to me. I always had to use other tools for this analysis. But now in Wireshark it makes a lot of fun to play with this graph. It was like they put the graphs from an vw beetle into a porsche. WOW so should it be.
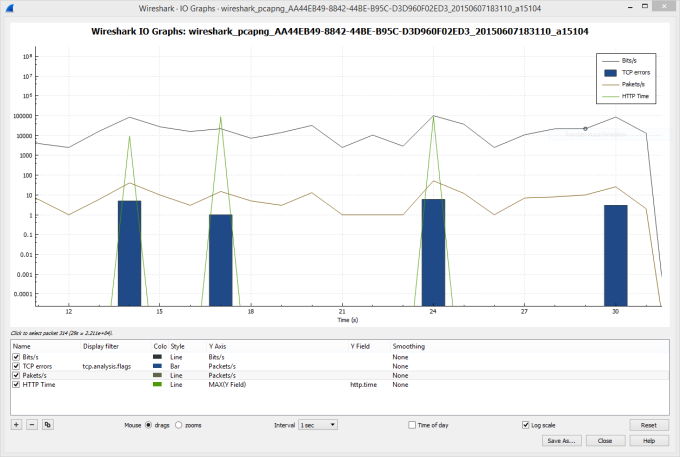
Third great improved feature: IO-Graphs
If you are working with greater capture files than the fastest way to get an overview of the trace file is the graphical analysis for me. Wireshark calls this feature I/O Graphs and if you open it the first time you see the packet/s. Not so cool, you may think. But if you go deeper then you find out that you can use display filters to manipulate the graphs. For example you can count the “arp broadcasts per second”
And if you go even deeper you can draw field values or maximum values with the advanced filters. For example it is possible to draw the http response times. So it could be a really effective tool especially if I want to report something. But in the past (Wireshark 1) it was sometimes a little bit tricky to find the right scales. I would like to say that the whole I/O Graph usage has been improved in all.
But the most noticeable improvement for the most people, will probably be, that it is now possible to display bits/s, packets/s and values in one combined Graph easier than in the stable version. And also I have a legend this is a nice feature if you want to put the graph into a report or a mail.
Update 23. June 2015:
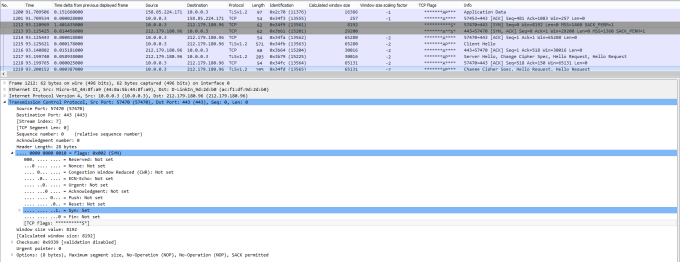
Yesterday I have found one more great feature, the displaying of the TCP Flags as an own column. In the past the most significant TCP-Flags have been presented in Info column or you had to made a own column for each bit. With Wireshark 1.99 a new field has been introduced. The “tcp.flags.str” so now it is possible to present the flags as an own column. And it looks really great. I had missed this field in the past sometimes.
That is what I want to tell about the new / improved feature of Wireshark 1.99.
From my point of view these improvements are are really great. Well done so far…
Have a nice day…


Hey,
I’d like to ask if you know how can I delete that crazy title of graph.
Because when I want to export graph as a picture it has this title:
Wireshark IO Graphs: wireshak_pcapng…
and I really don’t know what to do.
Thanks
LikeLike
Hi Tomas,
well the title of the graph is the filename of the tracefile. In my example it has a strange name, that is true.
LikeLike
OK, never mind. i figured it out.
Thanks again for your reply, it helped a lot!
LikeLike