
End User Experience measuring to support the network analysis process

End User Experience measuring to support the network analysis process
The number of Graphical User Interfaces (GUI) which are using HTTP as the application protocol is still growing up. And each single website of these applications has often a complex dynamical content. Therefor these sites are generating a lot of diversity http-Requests before the site is fully presented to the user. And also after this full presentation the dynamic content is still generating requests.
The “End User Experience View” is getting more and more important, because for the above mentioned reasons it is not easy to realize if the whole content has been loaded with nothing more then a trace file and no deeper knowledge of the application. And also the whole http analysis is often hard work, because it is a strong interactive protocoll. For example if the user does nothing for about 1 minute or then it could be that you see a gap of 1 minutes in a trace file. And without the knowing what the user has done it could be hard to say if such a gap is ok or not. So there are few reasons why it could be important to have the same view like the user:
- The failure is often presented with the clearest sight at the user
- User are felt comfortable if support hotline could measure her emotions
- The failure situation of sporadic failures could be discussed with the user
- The tasks of different departments could be better coordinated
- Errors are often hard to find with nothing more than the End User description of the error, e.g. “The site is damned slow, mostly”
- Google rates the load time of a page at its ranking algorithm
Possibilities of End User Experience measurement
At the moment there are a few nonfree tools availabe, which are next to a Browser Plugin and also have a export function for a detailed offline analysis.
Furthermore some manufacturers of monitoring solutions e.g. Riverbed where able to monitor the end user experience of a monitored webserver. They are reaching this goal by Java Script snippet injection. This snippet measures the load time and sends the results back to the monitoring appliance. So it is possible to monitor the websites fast and efficient. This all works a little bit like “Google Analytics”.
Since Google votes the load time of a page for the ranking result all large browsers have built in, so called “developer tools” with this tools it is possible to display the detailed load time of a page in a graphical way.
But often this analysis results can´t be exported or imported for an offline analysis.
But this problem could be shifted around with the combination of two freeware tools.
For the data export and recording the great freeware tools Firebug with its plugin Netexport can be used for the Firefox browser. The gathered data could be exported as an “HAR-Archiv” for later offline analysis. Also the developer tools of the Google Chrome browser supports the HAR export. A List which tools are supporting the HAR-format can be found at this URL. http://www.softwareishard.com/blog/har-adopters/
One of the most popular tools is the HARViewer. The HARViewer is a web based application which parses the HAR Files and present the results in a graphical way. The presentation is very close to the presentation used by Firebug. This is no big surprise because both tools have been written by Jan Odvarko.
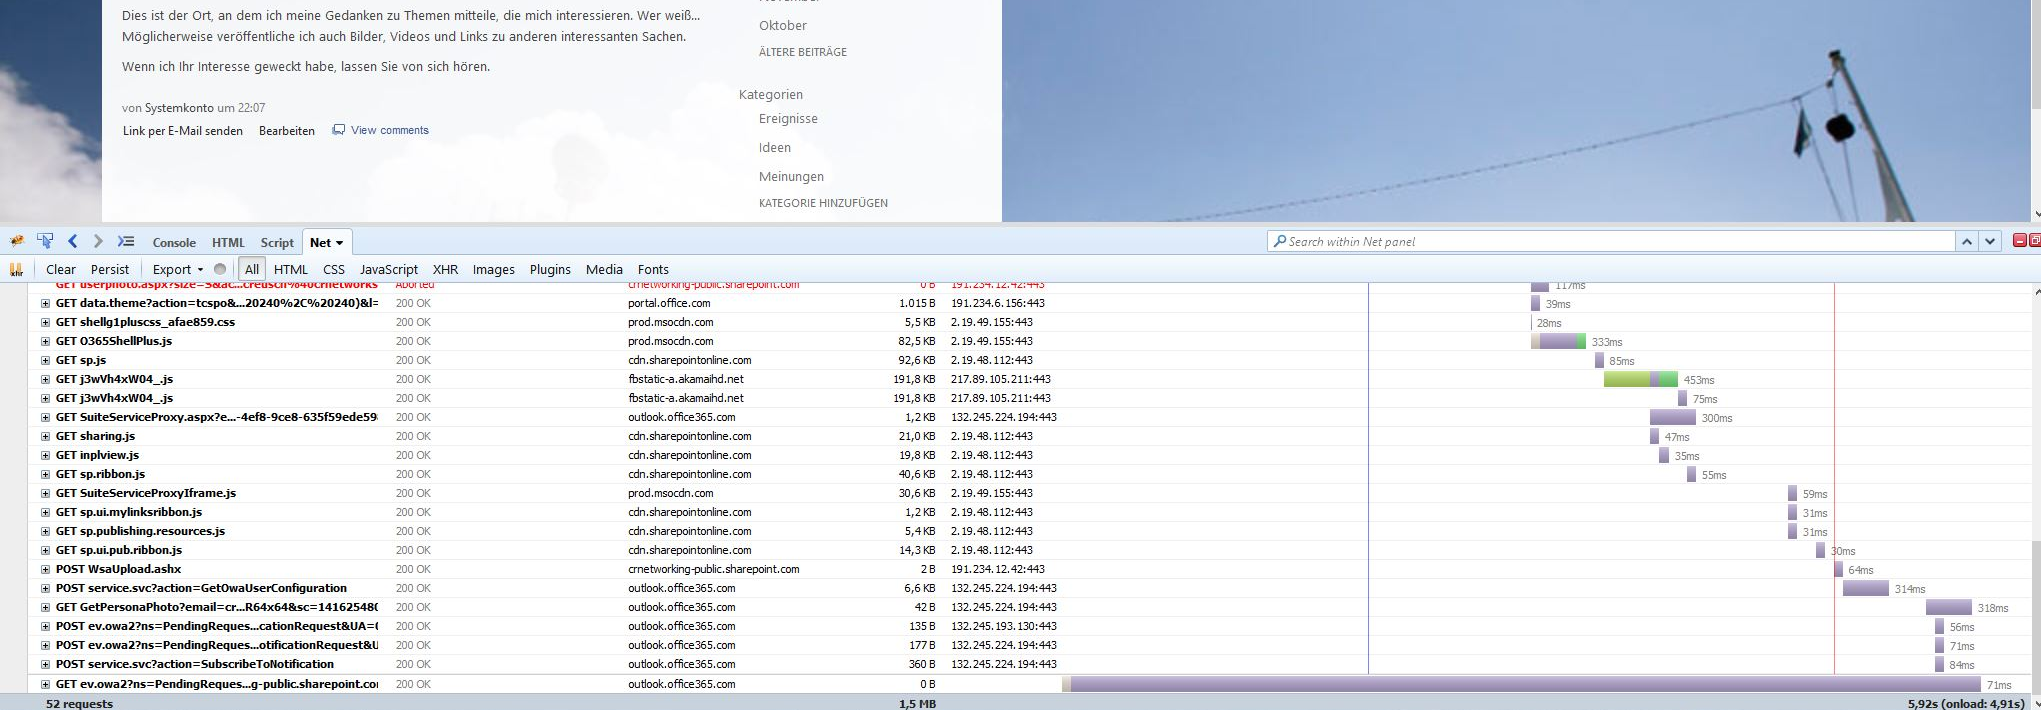
Firebug / NetExport
But often there are a few good reasons why you don´t want to POST your HAR files on a page which is not at your control.
Therefor you could use a local installation the source code can be found and downloaded here https://github.com/janodvarko/harviewer
After that the code can be executed at your own webserver which supports PHP.
Or you can easily download the Google Chrome App “HTTP Archive Viewer App” from the Google Chrome Webstore for the Google Chrome browser.
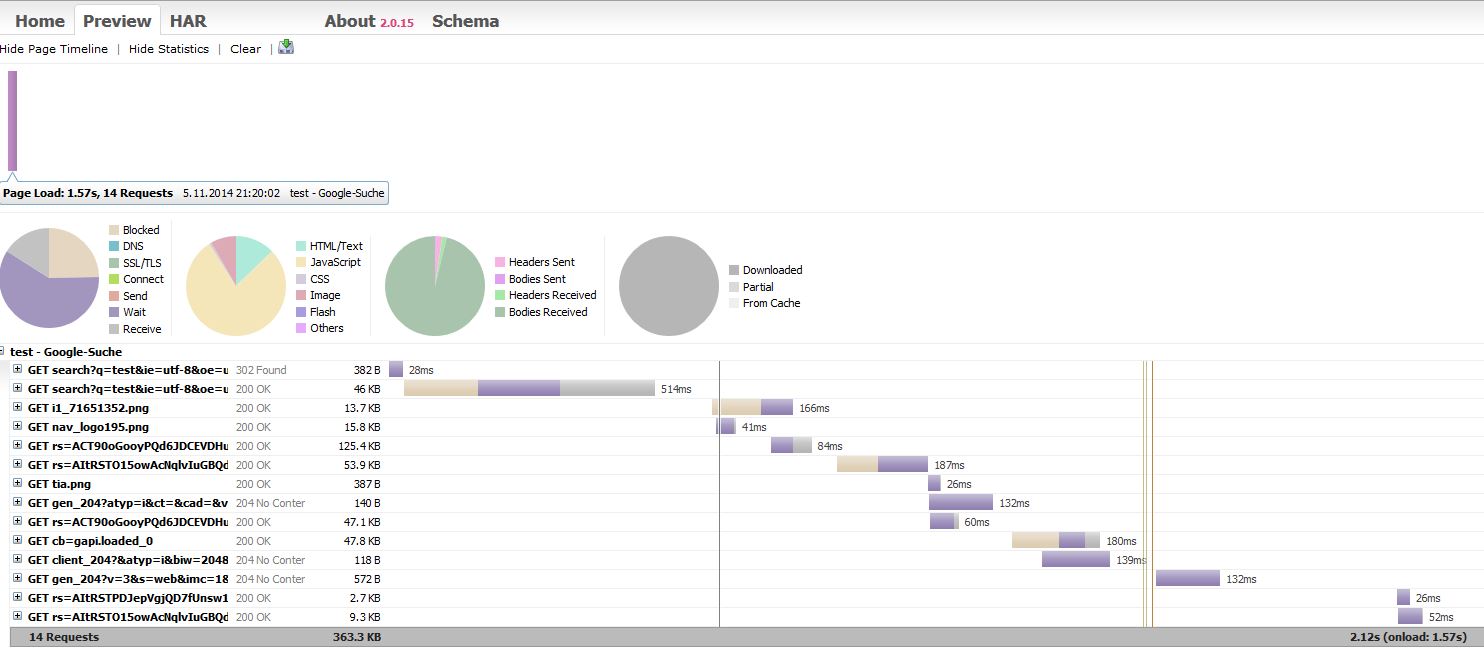
Offline analysis with the HarViewer
The HARViewer also can parse the JSON file format.
Transform a PCAP file into a HAR file
The graphical presentation which is provided by the HARViewer for a HAR file could be applicated to a pcap file which contains HTTP content. Therefor you could use the CLI-Tool pcap2har which is written in python. Afterward the converted data could be visualized with the HARViewer. An alternative way to do this is to upload a pcap file to the website https://pcapperf.appspot.com/ where the pcap file will be converted into a har file and analyzed at that page in a HARViewer. This page uses the HARViewer and the pcap2har tool. But this is again a service which you don´t control.
Solution to gather some data on a client
There are a few possible solutions how to collect the data on a client. But I think one of the smartest solution is to prepare a Firefox Portable with an activated and customized Firebug / Netexport plugin. So you just have to send a zip file to an end user. After the end user has done his browsing with the portable app he just need to compress the folder which contains the Firefox Portable and send it back to you.
