
A look at the Profishark 1G+

Overview
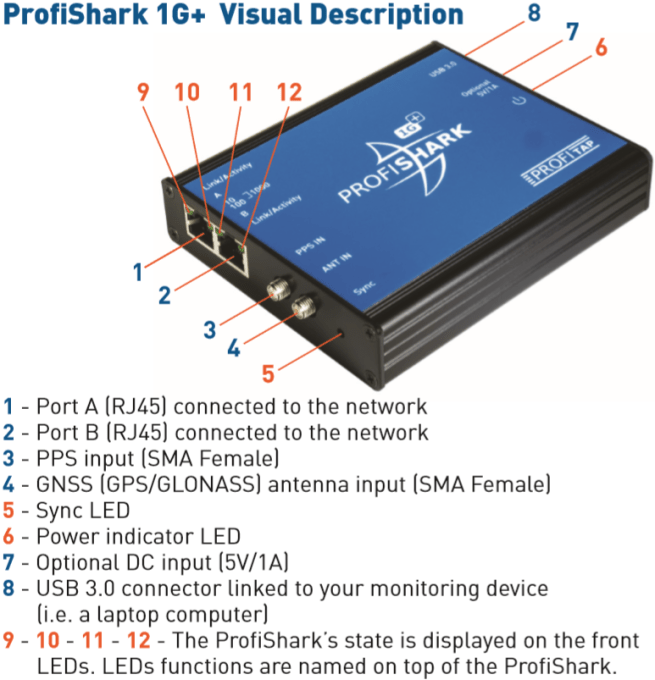
Profishark 1G+
There are quite lot of Gigabit Taps on the market right now and they all work more or less the same way (see Why I like using a tap even behind a mirror port).
But there is one different model series available (at least as far as I know) the ProfiShark Taps from Profitap.
They are different because they use the USB Bus for the monitoring traffic.
And to be honest this is an innovative way to do it, but for me it was not that big argument in the past, because the other taps have some other benefits, too. Which had balanced out the benefits of the Profitap for me, until now.
But when I stayed at Sharkfest Europe the Profitap guys had a booth there and I came into discussion with them.
They told me that the Profishark can also do some kind of timestamping and also has two different capture mode (in the 2nd Part I will write about it). And these are the features which makes me really curious, because they are not common for a tap.
So I decided to test a Profishark 1G+ after the Sharkfest Europe. And the test was somehow imnpressive to me, so I wanted to write this small review here a, to share my opinion about the Profishark 1G+ with you.
Let´s have a look at the the Features of the Profishark 1G+:
- 10/100/1G monitoring on USB 3.0
- USB 3.0 powered, no adapter required
- Non-intrusive, fail-safe monitoring
- Low delay, low jitter
- Hardware aggregation
- SPAN and In-Line modes
- 8 ns hardware timestamping for accurate latency testing
- GPS-linked timestamping with PPS synchronization for increased precision
- Real time statistics
- In-depth network port diagnostic and control
- Low level error and bandwidth monitoring
- CRC error capture
- Capture of any type of frames such as:
- short/jumbo/VLAN/VXLAN/MPLS/Pause frames and more
- Direct capture to disk
- Very low CPU usage
- Invisible to the network
- PoE compliant
- Lightweight and highly portable build
- Quick setup and easy to use
The difference between the Profishark 1G+ compared to the Profishark 1G is the:
- GPS-linked timestamping with PPS synchronization for increased precision
Installation:
The Profishark comes with an USB stick which contains the driver and manual or you can easily download the actual driver and manual from the Profitap website.
On Windows, you just have to install the Profishark executeable and a dialog will guide you through the installation process.
The installation contains the drivers, the GUI and a commandline tool.
Further you can install some Wireshark dissectors if you want to use the timestamping function for “NIC captures” described below.
Profishark Manager:
The Profishark Manager is the control center of the Profishark.
It provides the control of all functions of the Profishark.
- Statistics
- Logs
- Network Port Configuration
- Time Configuration (only 1G+)
- Firmware Update
- Live Capture setup
- Direct capture Setup
Statistics and Logs
The ProfiShark Manager provides some basic statistics and graphing functions.
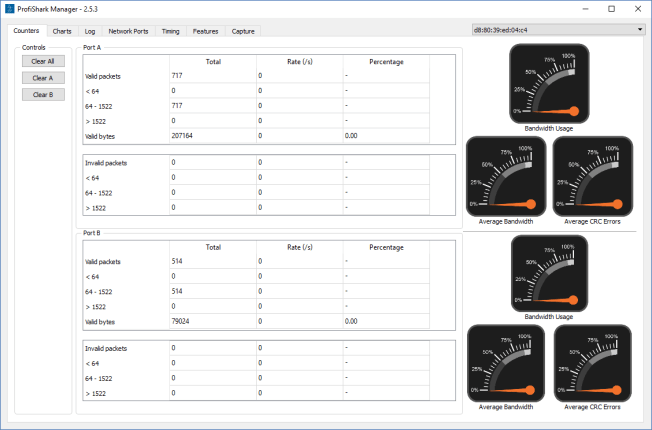
Profishark Manager – Counters
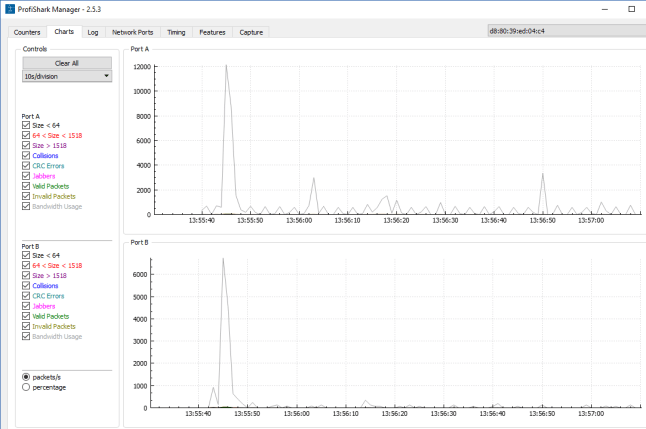
Profishark Manager – Charts
Also the ProfiShark can log some basic events. For example, if the bandwidth is above 50%. But the most important log entries are for me are the Link Up and Link Down log entries.
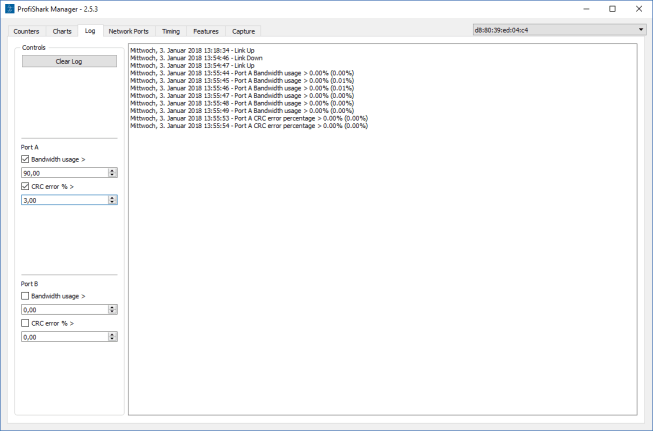
Profishark Manager – Logs
Network Port Configuration
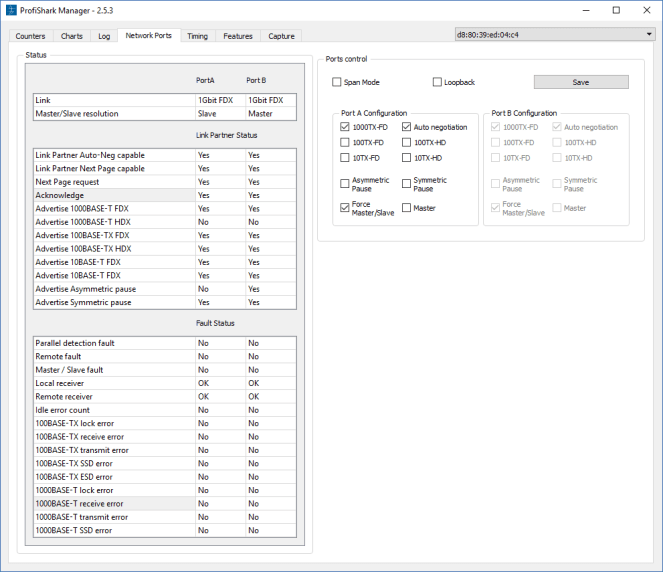
Profishark Manager – Network Ports Tab
In the Network Ports tab, the Network Ports can be configured.
First of all, you can choose between SPAN Mode or not. SPAN Mode means, that every link is terminated at the TAP separately and every Port can be configured with its own configuration.
This is needed for example, if you want to use a tap behind a mirror port.
But the normal mode should be the deactivated Span Mode, because in this mode the TAP works transparently to the network and link failure will be propagated over the TAP. This is the so called „Link Failure Propagation“ (LFP) Feature.
Loopback is only used for the ProfiShark 10G / 10G+.
In the Port configuration area, I recommend only to activate the features you want. For example, if you want to capture a 1Gbit/s full duplex link, then activate only Auto negotiation and the mode 1Gbit/s FD.
Timing
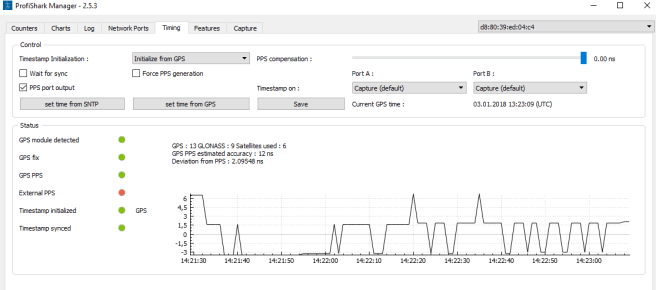
Profishark Manager – Timing_1
The Timing tab is only available for the ProfiShark 1G+ /10G+. Here all things around time setting can be configured. For example, the source of time initialization.
One interesting feature is that it can be configured when a timestamp should be set, while ingress, egress or capturing. This could be used e.g. for delay measurements.
Example of use: set one port to egress on a first ProfiShark and one to ingress on a second ProfiShark to measure the latency between both ports.
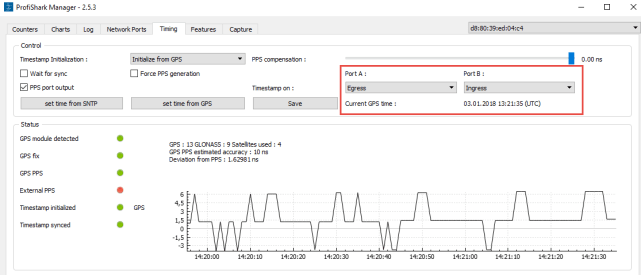
Profishark Manager – Timing_2
NIC Capture Mode
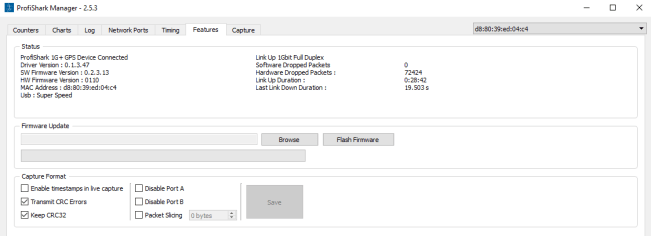
Profishark Manager Features Tab – NIC Capture Setup
The next tab is the so-called Features tab. Which provides the settings for the so called NIC capture mode or „Live Capture Mode“. In the NIC capture Mode the ProfiShark works and feels more or less as a normal network adapter and can be used in other programs like e.g. Wireshark (WinPcap).
On the other hand a Firmware update of the ProfiShark can also be done at this tab.
But let´s have a deeper look at the capture options.
First of all there is the „Enable timestamps in live captures“ which adds an additional header to the Frames with a precise timestamp information. For this header we have already installed the additional Wireshark dll on our system. And here comes the problem, if you use this feature then you can analyze your traces only with that pimped Wireshark version. So it is of course a great and fantastic workaround, but there might be a better way (As we will see in the second Part of this review).
So, I recommend to turn this feature off for the most cases.
Transmit CRC errors means that the corrupted frames are also captured by the ProfiShark.
Keep CRC32, means that that the Frame Check Sequence Number is also stored in the capture.
For this we have to edit the following settings in Wireshark: (Edit -> Preferences -> Protocols -> Ethernet -> Assume packets have FCS)
Disable Port A / Port B: If activated no packets will be captured on that port. Or if both are activated, no packet capture will occur.
With packet slicing you can slice the packet to a length of 128 Byte. But it is done in a hard way, so Wireshark will show Bytes on wire and captured bytes as the same value, this makes further TCP analysis next to impossible.
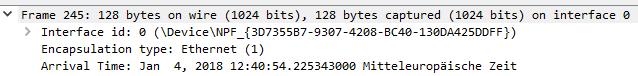
Wireshark with a Trace sliced by the Profishark
So I really recommend to disable that feature and use a tool like Tracewrangler for slicing. Or when you want to trim the whole pcap file you can try TrimPcap.
Final Words:
There is still one feature missing on my review, the so called „Direct capture Feature“. But this feature was so surprising to me, that I will write about that in the second part of this post. Also, I will write there more about the capture performance of the ProfiShark 1G+.
But so far, I can say the ProfiShark 1G+ is a handy network tap. I think he is at his best for Field Engineer purposes which needs a small and easy to use network tap.
But I really recommend using an additional Power supply otherwise it can happen, that a reboot of your laptop forces down your productive network.
A lot of features provided by this Tap most of them are useful and nice to have. A recommendation for disabling some features I have already given, especially the slicing and the autoneg settings.
Another remarkable thing is the support, I had two problems during this Test:
- An installation problem
- A problem with corrupted capture files
But both bugs had been solved within two days by the guys of Profitap.
At the end I would like to say thank to the guys of Profitap for providing me a demo Tap for this small review here.

Hi Christian. Thanks for your article. I am using the ProfiShark 1G (without +) as well.
I ran into two minor problems during my work:
1) For every USB 3.0 port to which the ProfiShark is connected to a new network card is installed by Windows. Hence I was a bit confused as I plugged it into another USB port and got another “Ethernet 9” or whatever number. The irritating point was that I need to restart the WinPCAP driver (or reboot the machine) each time a new Ethernet adapter was installed. On one day I was like “why can’t I see my ProfiShark as I used it just yesterday”, until I saw that I used another USB port.
2) During the initial driver installation from Profitap all protocol checkmarks within the Ethernet adapter are disabled. This is a MUST because otherwise you get some strange packets in Wireshark since Windows uses the ProfiShark as a “normal” Ethernet adapter. BUT: As I am using the ProfiShark on different USB ports (which installs more than one adapter, see first point), those checkmarks are NOT disabled by default. I need to disable them manually to get rid of some Windows generated packets within my trace files. (In other words: I really did expect that NO SINGLE packet is displayed in Wireshark when I am using this TAP. But this was NOT true until I disabled all checkmarks from the Ethernet adapter.)
Ok, quite a long comment. I hope that everything is understandable.
Cheers,
Johannes
LikeLike
Pingback: How to turn your computer into a high precision packet capture machine with the Profishark 1G+ | CRnetPACKETS
Pingback: My Network Companion: The ProfiShark | Blog Webernetz.net